Accessing the Chrome Developer Tools: Before we dive into debugging with the Chrome Console, let’s first understand how to access the Chrome Developer Tools:
- Open Google Chrome.
- Navigate to the webpage or web application you want to debug.
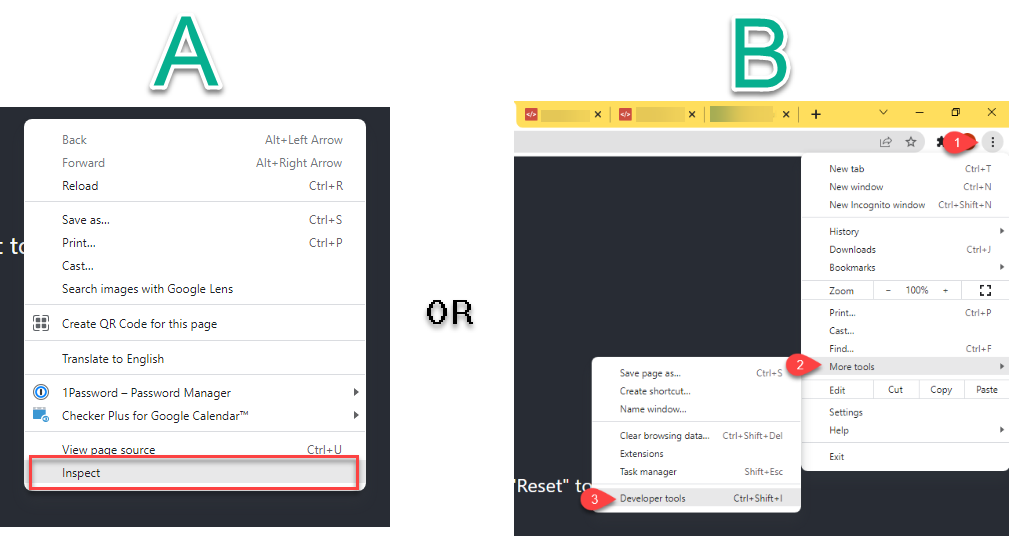
- Right-click anywhere on the page and select “Inspect” from the context menu, or press “Ctrl + Shift + I” (Windows/Linux) or “Cmd + Opt + I” (Mac) on your keyboard.
- This will open the Chrome Developer Tools panel at the bottom or side of the browser window.
Understanding the Chrome Console: Once you’ve accessed the Chrome Developer Tools, you’ll find various tabs, including Elements, Console, Sources, and more. For debugging JavaScript code, we’ll focus on the Console tab.
The Chrome Console serves as a JavaScript console where you can execute JavaScript commands, log messages, and inspect errors. Here’s how you can use it effectively:
- Executing JavaScript Code:
- Simply type JavaScript code directly into the Console and press Enter to execute it.
- You can also execute multi-line JavaScript code by pressing Shift + Enter to create a new line.
- Logging Messages:
- Use the
console.log()function to log messages, variables, or objects to the Console. - For example,
console.log('Hello, world!')will output “Hello, world!” to the Console.
- Use the
- Inspecting Errors:
- If your JavaScript code encounters an error, the Console will display error messages along with the file name, line number, and stack trace.
- Clicking on the error message will take you to the exact location in your code where the error occurred.
- Debugging with Breakpoints:
- Set breakpoints in your JavaScript code by clicking on the line number in the Sources tab or directly in the Console using the
debuggerstatement. - When the code execution reaches a breakpoint, it will pause, allowing you to inspect variables, step through code, and identify issues.
- Set breakpoints in your JavaScript code by clicking on the line number in the Sources tab or directly in the Console using the
- Utilizing Console Methods:
- In addition to
console.log(), the Console provides various other methods for logging different types of messages, suc - h as
console.error(),console.warn(),console.info(), andconsole.table(). - Experiment with these methods to enhance your debugging workflow and gain insights into your code’s behavior.
- In addition to
Chrome DevTools offers a comprehensive set of features to analyze and optimize website performance, including testing website speed. Here’s how you can utilize Chrome DevTools to evaluate the speed of a website:
- Accessing Chrome DevTools:
- Open Google Chrome and navigate to the webpage whose speed you want to test.
- Right-click anywhere on the page and select “Inspect” from the context menu, or press “Ctrl + Shift + I” (Windows/Linux) or “Cmd + Opt + I” (Mac) on your keyboard to open Chrome DevTools.
- Alternatively, you can access Chrome DevTools by going to Chrome’s menu (three vertical dots) > More tools > Developer tools.
- Using the Network Tab:
- Once Chrome DevTools is open, navigate to the “Network” tab.
- Reload the webpage (Ctrl + R or Cmd + R) to capture network activity.
- The Network tab displays a waterfall chart showing the loading times of various resources (HTML, CSS, JavaScript, images, etc.).
- You can analyze the loading times of individual resources, identify slow-loading assets, and troubleshoot network-related issues.
- Performance Tab:
- Switch to the “Performance” tab in Chrome DevTools.
- Click the record button (a circle) to start profiling the webpage’s performance.
- Interact with the webpage to simulate user actions (scrolling, clicking, etc.).
- Click the record button again to stop profiling.
- The Performance tab provides a detailed timeline of events, including JavaScript execution, rendering, and loading times.
- You can identify performance bottlenecks, such as long-running JavaScript tasks or inefficient rendering, and optimize accordingly.
- Audits Tab:
- Navigate to the “Audits” tab in Chrome DevTools.
- Click “Perform an audit” to run a performance audit on the webpage.
- Chrome will analyze various aspects of the webpage, including performance, accessibility, best practices, and SEO.
- After the audit completes, Chrome will provide a report with recommendations for improving website speed and overall performance.
- Other Features:
- Elements Tab: Use the Elements tab to inspect and modify the HTML and CSS of the webpage. You can identify and fix rendering issues, adjust styles, and debug layout problems.
- Sources Tab: The Sources tab allows you to debug JavaScript code, set breakpoints, and step through code execution. You can also analyze network requests and modify JavaScript on the fly.
- Console Tab: The Console tab is useful for logging messages, debugging JavaScript code, and inspecting errors. You can execute JavaScript commands, log variables, and troubleshoot runtime issues.